The Commercial Contradiction
Growth programmes in telecoms are often split by design. Marketing owns CAC. Commercial and operations own margin, retention, collections, product yield. In most operators, those teams sit in different systems, different reporting structures, and often enough, different buildings.
South Africa's mobile market has been showing the consequences of that split in public results data for several years. The same pattern appears across every major operator, and the shape of it is always the same: subscriber counts, data traffic, ARPU, prepaid revenue, and channel economics don't move together. A business growing its subscriber base can be simultaneously shrinking its per-subscriber revenue, inflating its channel costs, and deferring a base quality problem it will eventually have to correct by force.
Vodacom, MTN, Telkom, and Cell C each provide a version of this lesson.[1][2][3][4][5][6][7]
Vodacom's four-year prepaid arc is the most detailed case. In FY2024, adding 7.3 million prepaid customers to reach 44.9 million pushed ARPU down 5.2% to R55, with low-ARPU additions cited as part of the pressure. In FY2025, the approach reversed: the base was actively shrunk to 39 million (-13.1%) by removing inactive customers, and prepaid mobile customer revenue rose 3.5% to R27.3 billion with Q4 ARPU recovering 12.2% to R55. The FY2026 full-year result continued the pattern: prepaid mobile customer revenue down 2.1% to R26.7 billion, base up a modest 0.4% to 39.1 million, ARPU up 7.4% to R58, data traffic up 32.1%, data customers down 4.3% to 26.5 million as seasonal offers supported consolidation onto a primary SIM. Subscriber volume, revenue, ARPU, data usage, and customer count all moved in different directions across the same period.
MTN SA shows the same divergence from a different angle. In FY2025, total subscribers grew 1.9% to 40.6 million and data traffic rose 27.3%. But prepaid subscribers declined 0.7% to 29.7 million and consumer prepaid service revenue fell 2.3%, even as prepaid data usage grew 28.4% to 4.2GB monthly. More subscribers, more data traffic, less prepaid revenue. MTN's own response to this named the levers clearly: regional offers, personalised bundle pricing, channel optimisation, device financing, bad-debt reduction in third-party channels. Not marketing levers. Commercial controls sitting across pricing, channel, and credit.
Telkom's Q3 FY2026 result shows what happens when those levers are actually pulled. Prepaid service revenue grew 11.6%, and Telkom attributed it directly to Customer Value Management in its own results commentary. An unusual disclosure, and a useful one. Mo'Nice and Mo'Town contributed 53.1% of prepaid service revenue. Prepaid subscribers grew 5.8% to 22.2 million. ARPU was stable at R61. Airtime lending grew 15.9% and accounted for 25.8% of prepaid recharges. This is what commercial-side CVM looks like when it's treated as a revenue engine rather than a retention afterthought.
Cell C adds the channel economics dimension. In 1H FY2026, prepaid subscribers grew 13.2% to 7.831 million. But prepaid ARPU fell to R71 from R78, driven by a 14% effective tariff reduction. Distribution-channel discounts ran at 10.6% of gross prepaid revenue, and Cell C stated that normalising those discounts toward 6% should add approximately R135 million to net prepaid revenue and EBITDA. Subscriber growth looked healthy. The net revenue picture behind it was considerably more complicated.
| Operator | What the data shows | Why it matters |
|---|---|---|
| Vodacom SA | Prepaid base, ARPU, prepaid revenue, data revenue, and primary-SIM behaviour moved differently across FY2024, FY2025, 1H FY2026, and the full FY2026 result. | Subscriber volume is not a proxy for value. Primary-SIM behaviour matters. |
| MTN SA | Total subscribers and data traffic grew in FY2025, but prepaid subscribers and consumer prepaid service revenue declined. | Data traffic and subscriber growth do not automatically translate into prepaid revenue growth. |
| Telkom | Prepaid service revenue grew 11.6% in Q3 FY2026, with the company attributing it to Customer Value Management. Mo'Nice and Mo'Town contributed 53.1% of prepaid service revenue. | CVM can be a reported prepaid revenue driver, with measurable outcomes cited by the operator in its own results. |
| Cell C | Prepaid subscribers grew 13.2% in 1H FY2026, but ARPU fell; distribution discounts ran at 10.6% of gross prepaid revenue; normalising those discounts was expected to add approximately R135 million to net prepaid revenue and EBITDA. | Channel economics and discount structure affect net revenue in ways that gross-add reports don't capture. |
The same commercial lesson, four versions. Gross-add metrics record that an acquisition event happened. They don't record whether the customer became active, primary-SIM, margin-positive, and worth retaining. That is the gap Cohort True CAC is designed to expose.
What the Vodacom arc shows, in particular, deserves a precise reading. Vodacom frames the ARPU improvement as a function of a healthier but lower average subscriber base, continued attention to gross-add quality, and improved data revenue monetisation. From public results alone, an external reader can't cleanly separate the effects of inactive-customer optimisation, pricing, seasonal offers, and data monetisation. But what the results do show is commercially significant: gross-add growth can shift base mix in ways that take years to correct, and the correction moves ARPU, revenue, data usage, and customer count in different directions simultaneously.
A closed-loop CVM model is designed to bring that quality view forward. Instead of allowing weak activations, dormant SIMs, or low-value cohorts to accumulate and correcting the base retrospectively, the operator measures acquisition quality at D7, D30, D90, and D180. It joins the acquisition source to usage, balance, recharge behaviour, support cost, settlement, and margin quickly enough to distinguish a primary-SIM relationship from a dormant activation while intervention is still possible. Vodacom's multi-year trajectory points to the destination: a smaller but more commercially active base, stronger ARPU, growing data revenue per remaining user. Getting there through continuous measurement and early intervention is the operating model this paper describes.
The arithmetic behind all of this is uncomfortable. Bain & Company's published Sub-Saharan Africa research, though dating from 2019, documents churn in South Africa running three to four times higher than in developed markets.[8] In that environment, the economics of acquiring subscribers without a value architecture are hard to sustain. Losses can accumulate inside gross acquisition metrics for a long time before they surface in the quarterly review that finally forces someone to act.
Acquisition efficiency and value realisation need to be run as one operating model, with shared measurement, shared data, and shared accountability for what happens to a customer after they sign up.
Why CAC Programmes Underperform
Three things go wrong, and they tend to compound each other.
The measurement model stops too early
Most acquisition programmes are optimised to cost per lead, cost per signup, or attributed conversion. These numbers are easy to generate and easy to report. They're also incomplete. What the business needs is CAC per activated and retained cohort (what this paper calls Cohort True CAC). Where channel quality varies, tariff cohort behaviour diverges, and acquisition economics are opaque, the gap between the sticker figure and the real one can be significant.
The acquisition engine is flying blind
If the team responsible for acquisition can't see activation rates, balance behaviour, complaints, retention status, usage mix, or account-level value, it will optimise to what it can see. Usually, that means short-term conversion. Most operators can report gross subscriber adds with precision. Far fewer can report CAC per retained and profitable cohort at D90. That gap is where value disappears.
The systems that act and the systems that record don't talk
A campaign can create demand. Capturing value from that demand depends on whether the platform can fulfil the offer, enforce the pricing model, control balances, manage bundles, execute upsell, and accurately reflect partner economics. Campaign-layer CVM tools are genuinely useful for segmentation, orchestration, recommendation, and measurement. Their limitation appears when recommendation has to become governed commercial execution. Unless the campaign layer is connected to the systems that hold charging, billing, balance management, fulfilment, payments, settlement, and revenue controls, it can identify an action but can't guarantee that the action is commercially valid, operationally executable, or financially controlled.
A campaign platform can recommend. The operator captures value only if the systems of record can enforce.
The Cohort True CAC: the diagnostic that changes the conversation
The most important shift available to any operator is moving from gross CAC to Cohort True CAC. It's a different calculation that follows the acquisition cohort through each commercial stage rather than stopping at the signup event.
The formula:
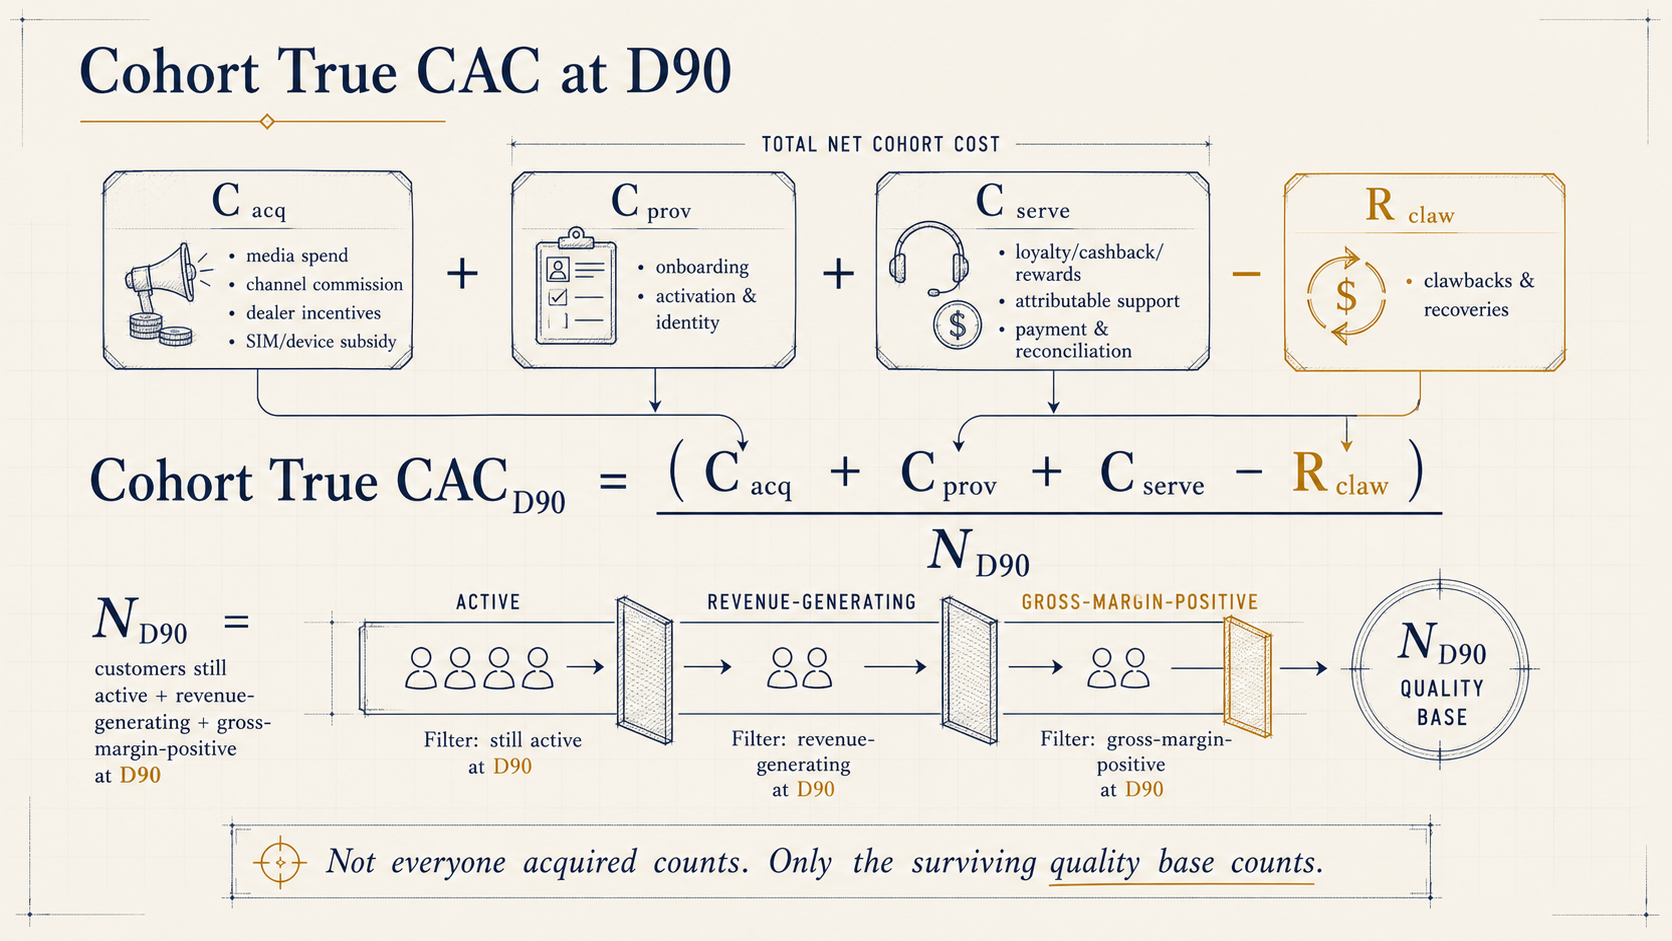
The numerator groups acquisition cost into three clusters, less recoveries.
Cacq. Acquisition cost. What it cost to win the customer: paid media, the channel's cut, dealer incentives, and any hardware or SIM subsidy.
Cprov. Provisioning cost. What it cost to bring them onto the network: onboarding, activation, and identity verification.
Cserve. Early-life service cost. Rewards or cashback included in the plan, the support load attributable to the cohort, and payment and reconciliation overhead through day 90.
Rclaw. Recoveries. Clawbacks and recoveries that offset the gross spend, subtracted before dividing.
The denominator is where the honesty lives. Conventional CAC divides by everyone acquired, which flatters the number. ND90 divides by the surviving quality base: only those who reach D90 still active, still generating revenue, and still gross-margin-positive. A customer who is active but margin-negative doesn't qualify. The three conditions are strict by design. That strictness is what makes the metric defensible.
For this purpose, gross-margin-positive means the customer's cumulative revenue over the measurement window exceeds directly attributable variable costs: wholesale network cost, usage cost, recharge or payment fees, support cost, commission effects, attributable fraud or credit loss, rewards cost, airtime-back cost or loyalty subsidy where applicable, and settlement costs. Fixed overhead is excluded unless the operator is using a fully loaded contribution model. Cohort True CAC is a management metric, not an accounting standard. Define the cost categories once, apply them consistently, and report by channel, tariff, geography, acquisition period, and cohort age.
The ladder:
The cohort moves through stages, and each stage is a smaller number than the one before. Gross signups become activated customers. Activated customers become active at D90. Active customers at D90 are not all gross-margin-positive. And gross-margin-positive customers haven't necessarily paid back their acquisition cost yet. Cohort True CAC forces the business to follow the cohort through each stage rather than declaring victory at signup.
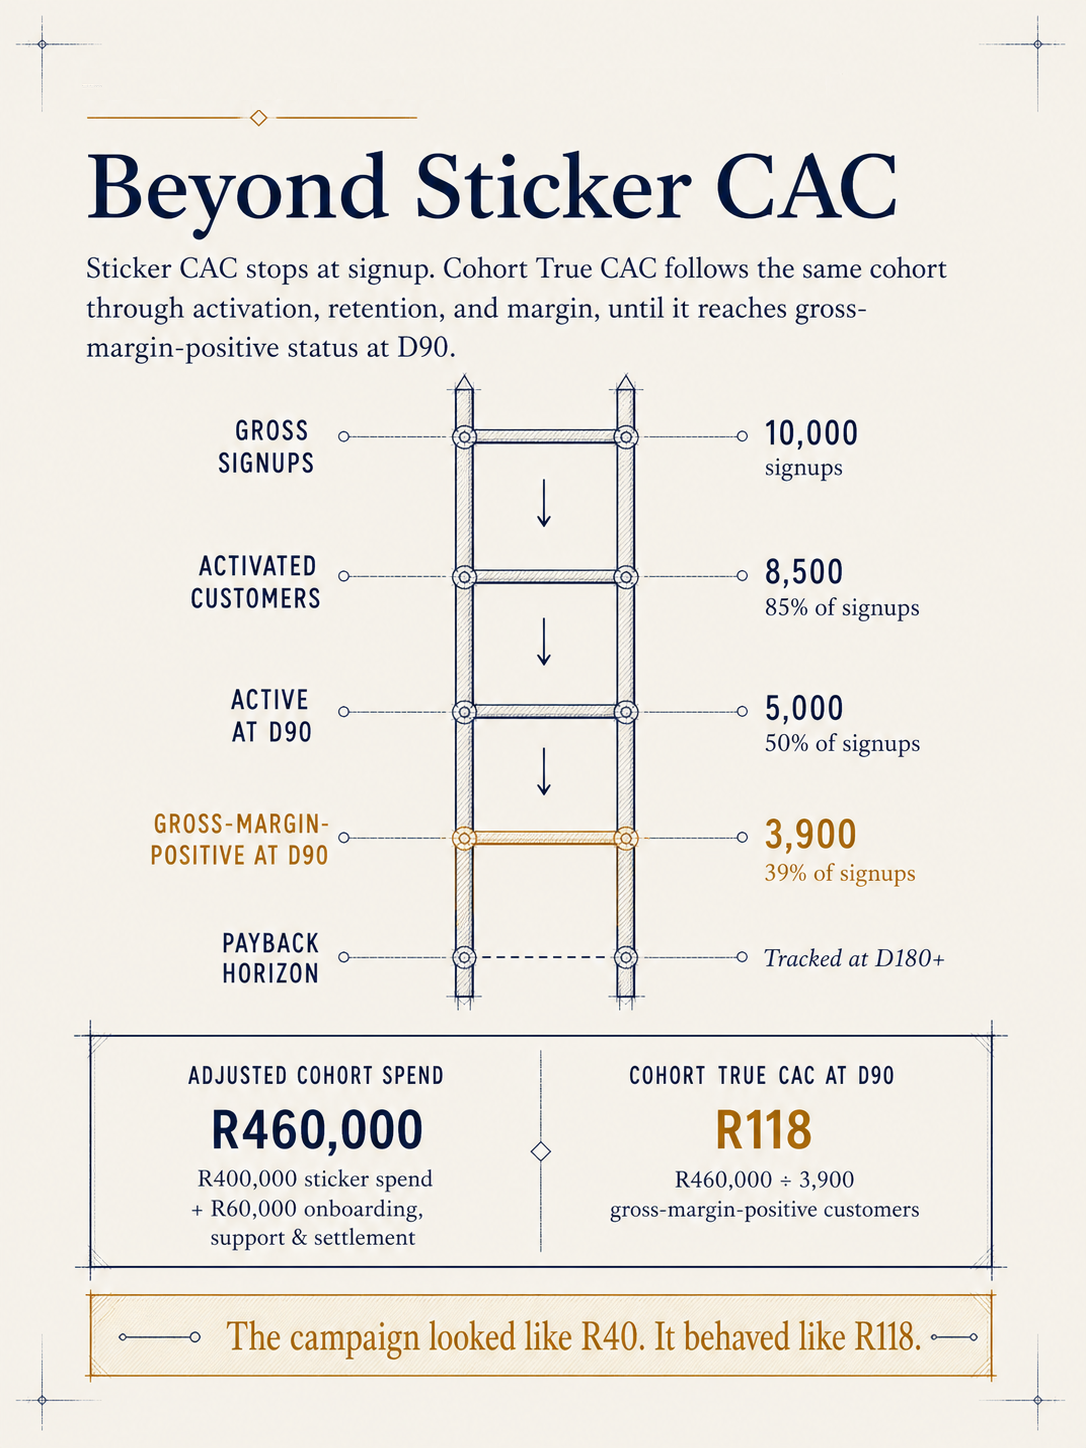
A worked example:
A campaign produces 10,000 signups at R40 sticker CAC, a total spend of R400,000. Of those, 8,500 activate. 5,000 remain active at D90. 3,900 are gross-margin-positive after usage, support, commission, and settlement effects. Additional onboarding, support, and settlement costs add R60,000 net of clawbacks. Cohort True CAC at D90 is R460,000 divided by 3,900: R118 per value-carrying customer. The campaign looked like R40. It behaved like R118.
When to measure:
D90 is a useful anchor, but it isn't the only one. In prepaid markets, the same cohort is worth tracking at D7 (activation quality), D30 (whether the customer repeated usage or top-up behaviour), D90 (whether they're still commercially active), and D180 (where payback and retention quality begin to show). The point isn't one universal horizon. It's a consistent ladder that prevents the business from mistaking signup volume for value at any stage.
The table below shows how each view differs in what it enables.
| Metric | Gross CAC view | Cohort True CAC view |
|---|---|---|
| Acquisition cost measured | Spend per gross signup | Total acquisition cost per cohort by channel and tariff, net of clawbacks |
| Revenue assumed | ARPU × expected contract life | ARPU × actual retention months by cohort, by channel |
| Early-churner value | Counted as "acquired" | A loss: revenue recovered is a fraction of acquisition cost before any service cost |
| Channel visibility | Volume only | CAC broken out per channel and tariff cohort |
| Commission structure | Paid on activation regardless of what follows | Staged, held back, or clawed back based on cohort performance; only enforceable at the systems-of-record layer |
| Decision enabled | Grow gross adds | Identify and protect margin-positive channels; stop funding loss-making ones |
Operators who run a Cohort True CAC analysis for the first time often find that their best gross-adds channel isn't their best margin channel; that certain tariff plans attract high-churn cohorts regardless of channel; and that some channel relationships are net-negative on a cohort basis even when the channel appears productive on paper.
One important caveat: this calculation requires the acquisition record to be joined to downstream revenue, usage, cost, and margin data. It can be performed retrospectively in a data warehouse. But it only becomes a closed operating model when the same data is available quickly enough to change channel funding, commission rules, offer eligibility, retention actions, and settlement controls.
Measurement can be analytical. Steering has to be operational.
Three Crucial Elements
A closed-loop CVM model needs three things. Each depends on the others.
| Element | What it requires | Why it matters |
|---|---|---|
| Value-based acquisition and measurement | Move from CAC per signup to Cohort True CAC, broken by channel and tariff | Stops the business from optimising short-term conversion at the expense of value. Reveals which channels and tariffs are profitable, not just productive. |
| Data quality and outcome visibility | Activation, balance, usage, churn, and settlement data connected to the acquisition record | Lets the acquisition side of the business learn from commercial outcomes rather than repeating the same decisions in the dark. |
| Layered architecture and enforcement | Decisioning at the enablement tier, commercial control at the systems of record | Ensures offers, discounts, and actions are commercially valid and operationally enforceable. Recommendation without enforcement doesn't capture value. |
The Two Loops Model
The commercial model breaks into two loops.
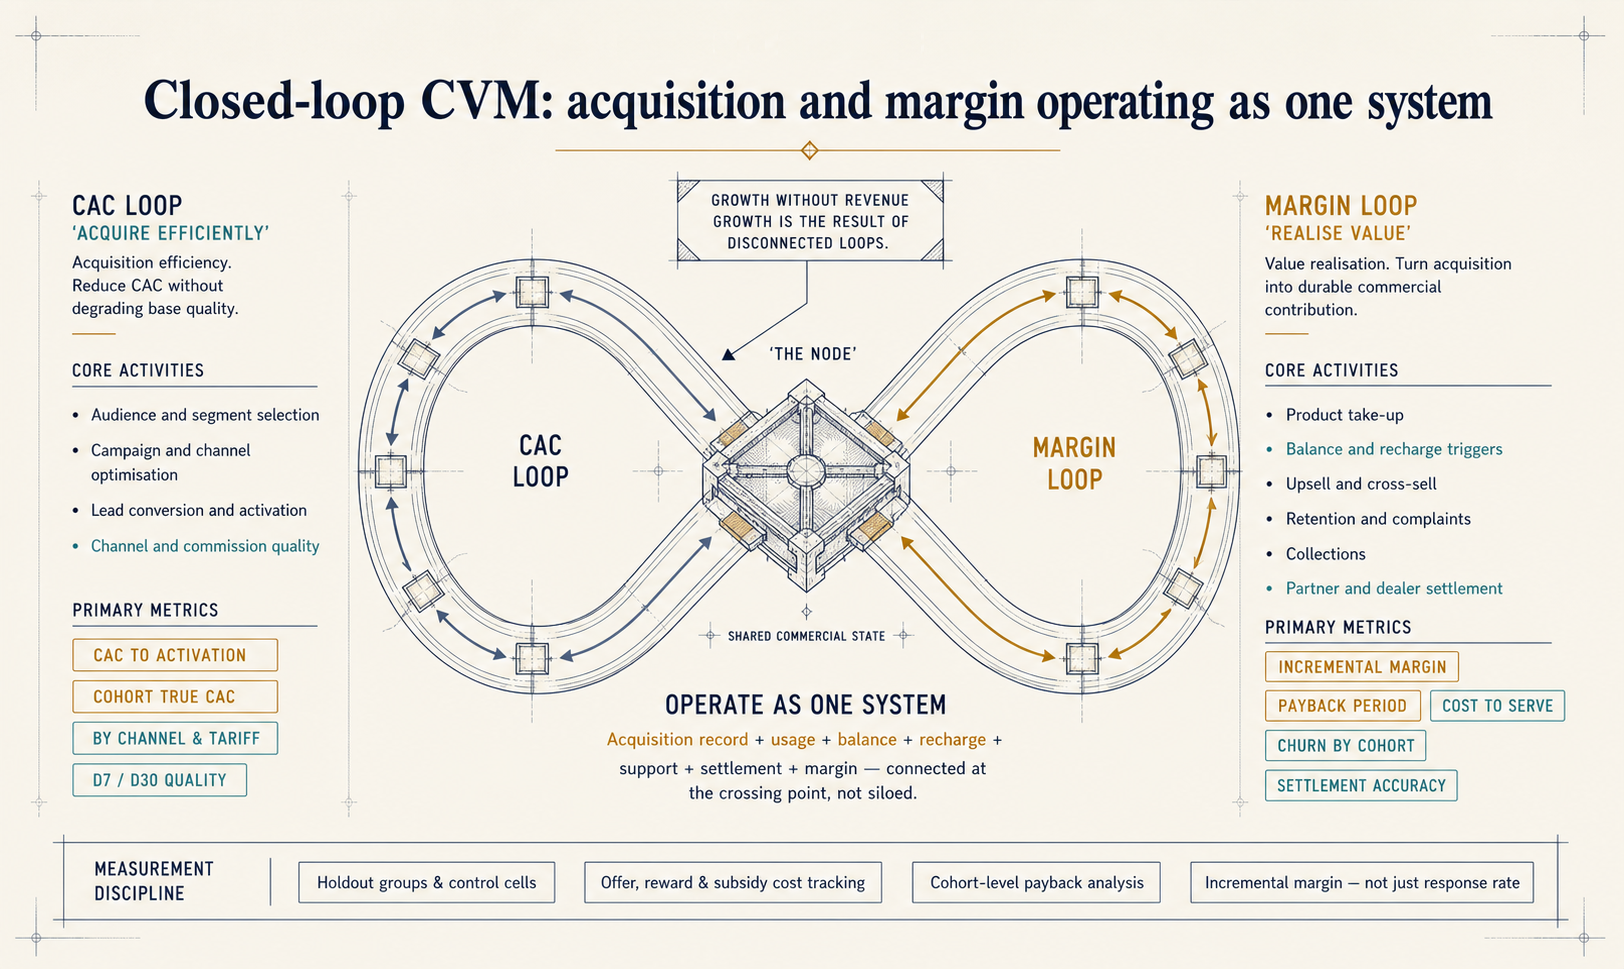
The CAC loop is about acquisition efficiency. Its purpose is to reduce CAC without degrading acquisition quality. Typical activities: audience and segment selection, campaign and channel optimisation, lead conversion, activation rate improvement.
The margin loop is about value realisation after the customer is acquired. Typical activities: product take-up, balance-triggered interventions, upsell and cross-sell, retention and complaints management, credit control, collections, partner settlement, margin reporting.
These loops are separate in logic but need to operate as one system. The CAC loop creates the customer. The margin loop determines whether that customer contributes commercially. When they're disconnected, which is the normal state for most operators, the result is the contradiction from Section 1: a growing subscriber base that isn't growing revenue.
| Loop | Primary focus | Typical actions | Primary measure |
|---|---|---|---|
| CAC loop | Acquire efficiently | Targeting, ad spend, lead conversion, activation | CAC to activation; Cohort True CAC by channel and tariff |
| Margin loop | Realise value | Upsell, retention, spend control, ARPU growth, collections, partner settlement | Incremental margin, churn by cohort, payback period, cost to serve |
The model is clear enough on paper. The harder question is whether the two loops in a given operator's business are actually functioning as one system, or whether they remain, in practice, two separate programmes reporting to different teams from different systems with different data. The questions that follow are the diagnostic.
A note on measurement discipline:
Closing the loop also requires a discipline that most CVM programmes skip. Operators need to distinguish observed performance from incremental performance. A retained customer isn't automatically proof that the intervention worked; they may have stayed anyway. Where volumes allow, it's worth using holdout groups, control cells, offer-cost tracking, and cohort-level payback analysis. The question isn't just response rate. It's incremental margin after offer cost, support cost, settlement effect, and churn avoidance. Without this discipline, CVM can become another way of subsidising customers who were already going to stay.
Five Questions the Current Model Cannot Answer
Each of the following questions marks a point where the CAC and margin sides of the business typically fail to connect. They're not rhetorical. And they share one feature: the tools most operators use to manage customer value can't answer them, because those tools were built to sit above the systems where the answers live.
Are you steering your cohorts, or just measuring them?
The margin side is supposed to feed commercial outcomes back into the acquisition side so that decisions improve each cycle. In most operators, this feedback exists only as retrospective reporting. The 90-day cohort report tells you what happened to the subscribers acquired in a given period, after the acquisition decisions have already been repeated. Campaign platforms can produce this picture well. In many deployments, what they cannot do on their own is act on it in the same motion: reading the cohort data, identifying subscribers still within reach, and triggering a commercial response before the outcome is fixed. Measurement and steering are different capabilities. Many campaign-layer tools were designed primarily for the first. The second requires something that can read the underlying data and act on it without waiting for the next campaign cycle.
Is your CVM system responding to events, or to schedules?
The margin side is supposed to act the moment a customer's commercial situation warrants it. A campaign fires on Tuesday. A retention offer triggers at the 90-day mark. A top-up prompt goes out on the first of the month. These are calendar decisions, not commercial ones. The customer whose balance ran out on Sunday, whose payment failed on Wednesday, whose usage pattern changed in week six rather than week twelve. That customer doesn't conform to the schedule the campaign was built around. Acting on live commercial conditions requires a persistent connection to the systems generating those conditions, not a batch job.
How long does it take your organisation to get from insight to action?
Here's what the gap between the two sides looks like in practice. A model produces a churn risk list. The list is reviewed. A campaign is briefed, built, approved. It goes out in the next send window. The customer who triggered the churn flag three weeks ago may already have decided. The lag isn't a resourcing problem. It's structural, sitting in the handoff between the system that detected the condition and the system that could have acted on it. A layer connecting those two systems directly, reading commercial state and triggering a governed response without a human chain in between, can compress that lag to the point where the response arrives while it still matters.
Do you know which of your acquisition channels is actually generating margin?
The CAC side, as most operators run it, optimises to gross adds by channel. That's a volume metric. It answers: which channel delivered the most subscribers? It doesn't answer what the margin side needs to know: which channel delivered subscribers who activated, used the service, paid their bills, and stayed long enough to repay their acquisition cost? In operators running disconnected acquisition and billing systems, no one has joined those two records at cohort level. The channel that looks productive on a gross-adds report may be the one destroying margin on a Cohort True CAC view. Campaign platforms typically hold the acquisition and response record. Billing systems hold the revenue record. In many operator environments, neither view is available in a single operational layer with enough speed and authority to change the next funding decision. A layer that reads across both and surfaces the cohort margin picture by channel is solving a different problem from campaign orchestration: it's connecting acquisition decisions to revenue, cost, margin, and settlement outcomes.
Does anyone in your organisation have a single view of a customer's live commercial position?
Both sides share a subject: the customer. But in most operators, that subject lives in fragments. Acquisition in a CRM. Billing on a separate platform. Activation in provisioning. Collections in another tool. The retention team working from a dashboard that refreshes weekly. Decisions about a customer, whether to offer a discount, retry a payment, escalate to a retention agent, or let the account lapse, get made without a coherent picture of where that customer actually stands commercially at the moment the decision needs to happen. Assembling that picture from fragments, in real time, requires an integration layer that reads state from each system, normalises it, and holds the aggregated commercial view continuously.
These aren't edge cases in poorly run operations. They're normal operating conditions in an industry that built its systems for a different era: one where acquisition and retention were sequential programmes, not parts of a single commercial loop. Campaign-layer CVM was a reasonable solution to the problem as it was understood a decade ago. It isn't sufficient now. The acquisition and margin sides of the business can't function as one system if the data connecting them lives in fragments across platforms that were never designed to share it. What changes that isn't a better campaign tool. It's a different kind of connection between the intelligence that drives commercial decisions and the systems that hold the commercial facts.
From Cohort Measurement to Cohort Steering
Campaign-layer CVM platforms are genuinely useful for segmentation, orchestration, recommendation, and measurement. Their limitation appears when recommendation must become governed commercial execution. Unless the campaign layer is connected to the systems that hold charging, billing, balance management, payments, settlement, and revenue controls, it can identify an action but can't guarantee that action is commercially valid, operationally executable, or financially controlled.
Most operators carry a combination of inherited platforms built at different times, by different vendors, for different purposes: a legacy billing system, a separate CRM, a provisioning layer, a collections tool. None were designed to share a unified commercial picture. The question isn't whether to replace the whole stack immediately. It's how to connect it well enough to close the loop.
Billing errors, reconciliation gaps, and payment collection failures are real operating costs that sit below the campaign layer, in the commercial systems of record. They cannot be addressed by campaign orchestration alone. TM Forum's Revenue Assurance Survey Report 2017/18 estimated average revenue leakage at 1.9% of revenues, with top-tier revenue assurance organisations achieving below 0.2% before recovery procedures.[9] The benchmark is older and survey-based, so treat it as directional. But the gap between best and average practice it describes is real, and a campaign platform operating without direct billing and settlement integration has limited visibility into it. It may report customer response. It cannot close leakage that originates in charging, reconciliation, or payment control unless it is integrated into the systems that govern those functions.
What bridges this gap is an adjacent layer that reads commercial state continuously from across the operator's stack and triggers governed responses through the APIs those systems already expose. It doesn't replace existing infrastructure. It operates across it, assembling the commercial picture that no single system currently holds.
In practice: reading billing events, activation records, balance movements, and usage data from wherever they live in the operator's environment; normalising them into a unified view of each customer's commercial position; and detecting conditions (a balance threshold crossed, a payment failed, a cohort's D30 behaviour shifting) at the point the data surfaces them rather than at the next scheduled campaign run. When a condition meets the policy the commercial team has defined, the layer triggers the appropriate response through the existing system's API: a self-care offer, a payment retry, a flag in the retention workflow. The response arrives while the moment still exists.
The depth of what gets enforced depends on what existing systems expose through their APIs. Where systems support direct write access, the layer executes immediately. Where the API surface is more limited, the layer detects and surfaces with enough precision that a timely human response is still possible. Either position is ahead of a campaign layer that lacks direct commercial-state integration. And as operators modernise individual stack components, the enforcement capability deepens without the intelligence layer needing to be rebuilt.
nfinity operates in both environments: as an adjacent intelligence layer across existing systems, or as the CVM module on fullCIRCLE NEXT where rating, charging, balance, catalogue, billing, payments, and partner settlement sit in one system of commercial record. In the adjacent deployment, enforcement depth is shaped by what the existing stack exposes. In the native deployment, the same operating model gains a deeper enforcement surface because the commercial data and the enforcement controls share a single foundation. It's a spectrum. Operators move along it incrementally.
Revenue Integrity and Channel Economics
Fraud, identity risk, SIM-swap exposure, subscription fraud, and revenue leakage reinforce the case for commercial-state visibility. They're adjacent to the acquisition quality problem, not identical to it.
The CFCA estimates total telecommunications fraud at $38.95 billion globally in 2023, roughly 2.5% of global telecom revenues.[10] In South Africa, COMRiC's sector reporting puts telecom-related fraud losses at approximately R5.3 billion annually, with fraud-linked transaction volumes up 78% between 2022 and 2023.[11] These figures cover all fraud categories and don't quantify channel or activation leakage specifically. But they show why identity, subscription, and SIM-swap events need to be visible in the systems governing activation, entitlement, charging, and settlement, not flagged in a campaign report after the fact.
What fullCIRCLE NEXT and nfinity Are
fullCIRCLE NEXT is TAUSPACE's BSS platform. Where deployed as the commercial foundation, it acts as the system of commercial record through which offer validity, real-time charging, balance management, and partner economics are enforced. nfinity is the CVM module that operates on this platform, and as an adjacent intelligence layer across existing operator systems. It provides the acquisition-to-margin measurement and intervention capability the closed-loop model requires, whether the operator is running on fullCIRCLE NEXT as their commercial foundation, integrating nfinity's layer across an existing stack, or moving incrementally between the two.
fullCIRCLE NEXT Capabilities for Closed Loop CVM
The capabilities below represent the commercial-control surface required for closed-loop CVM. In any specific deployment, operators should distinguish between capabilities that are native, configured, integrated, or roadmap-dependent.
| Capability area | What the platform supports | CVM implication |
|---|---|---|
| Billing, rating and balance | Unified rating, real-time charging, multiple wallets, threshold actions | Provides the billing, charging and balance controls required to reduce leakage between customer action and commercial outcome. |
| CRM and customer insight | 360-degree customer view, segmentation attributes, scoring cards, churn and spend dashboards | Provides customer context for value-based treatment. Enables Cohort True CAC analysis by connecting acquisition records to downstream behaviour. |
| Product and promotions | Configurable catalogue, bundles, add-ons, discounts, loyalty and partner packages | Allows rapid offer design without uncontrolled code changes. Ensures promotional terms can be enforced, not just recommended. |
| Channels and partner operations | Self-care, dealer, distributor and B2B portals with onboarding and order capture | Connects acquisition channels to activation records and downstream account behaviour, enabling quality monitoring across digital and retail touchpoints. |
| Financials and partner settlement | AR, payment allocation, revenue split and partner statements | Makes margin, channel economics and partner performance visible. Supports accurate settlement at the partner layer. |
What This Means for MVNOs and Telcos
The MVNO context
South Africa's MVNO market is growing. Published estimates differ by scope and forecast horizon, but Telecom Review Africa puts the market at approximately $505 million in 2025 and $750 million by 2030; Mordor Intelligence estimates a similar 2025 base with a projection of $784 million by 2031.[12] The precise number matters less than the commercial pattern playing out within it: this is a market where acquisition quality, loyalty mechanics, and operational controls determine survival, and the evidence for that is visible in the exit history.
Africa Analysis reports 38 MVNO brands launched in South Africa, with 21 currently active and approximately 3.8 million subscribers, up 19% year-on-year.[13] The market is growing. The survival rate is selective. Virgin Mobile SA operated for 15 years before closing in 2021.[14] Lyca Mobile exited in January 2024.[15]
These bank-MVNO examples are segment-adjacent to the telcos, not equivalent to them. Their relevance is that they show where MVNO value is moving: away from standalone SIM resale and toward embedded customer relationships where connectivity, rewards, payments, devices, and app engagement reinforce each other. The bank and retail MVNO cases in South Africa make this concrete.
| MVNO | CVM approach |
|---|---|
| Capitec Connect (Cell C) | Capitec's FY2026 annual report shows Connect net income of R442 million (up from R193 million in FY2025), with 1.5 million clients active in the last three months.[16] Data usage excluding reward data: 40.5PB. Airtime Advances: R97.3 million. Capitec operates as principal MVNO on Cell C's infrastructure, selling through its banking application. The acquisition journey, usage behaviour, reward mechanic, airtime advance, and revenue model sit inside one banking-led commercial relationship rather than a standalone SIM resale model. |
| FNB Connect | One million active subscribers.[17] In the 12 months to June 2025, customers used 26.2PB of data and earned approximately R29 million in eBucks on airtime purchases. FNB distributed data rewards with an estimated retail value of more than R4.5 billion. eSIM sales grew 127% cumulatively since October 2024 launch, representing 10% of monthly SIM sales, with over 64,000 devices sold worth R635 million. FNB Connect currently offers up to 15% back on SIM plan and prepaid bundle purchases, subject to qualifying account and programme rules. Mobile here isn't a standalone product. It's something you do inside your banking app, tied to rewards, eSIM onboarding, device purchases, and prepaid management. |
| Standard Bank Connect | Standard Bank's own newsroom reports more than 300,000 mobile customers, with bank fees offered back in airtime based on the customer's products and services.[18] Trade press reporting puts the figure closer to 350,000 following a network transition to MTN. The more interesting disclosure is why: Standard Bank said moving the MVNO technology stack in-house gave it more control over product structuring, reducing dependence on an aggregator. Product flexibility depends on who controls the stack. |
| Spar Mobile (MTN, May 2025) | Data rewards linked to grocery purchases.[19] Connectivity as a loyalty mechanic; the proposition is the differentiation, not the price. |
South Africa and Sub-Saharan Africa: why the argument is more acute here
The structural characteristics of Sub-Saharan African markets make the cost of running disconnected acquisition and value management systems higher, not merely similar to other markets.
ICASA's 2026 State of the ICT Sector report shows total mobile cellular subscriptions of approximately 117.3 million, with prepaid at approximately 96.5 million and postpaid at approximately 20.8 million, a prepaid share of roughly 82%.[20] More importantly, ICASA notes that some operators count SIMs not yet disconnected within their 90-day window, meaning reported totals can overstate the strict active-subscriber count. Active subscriptions on the 90-day definition declined 2.8% to approximately 91.4 million. The gap between total reported subscriptions and the active count is approximately 25.9 million. Treat it as a definitional gap, not a direct count of worthless SIMs. But it illustrates precisely the point this paper is built around: total SIM count is not the same as an active, value-carrying customer base.
Bain & Company's published Sub-Saharan Africa research identifies one in three SA subscribers using multiple SIM cards, with promotional arbitrage as the primary motivation, and churn running three to four times higher than in developed markets.[8:1]
| SA/SSA structural factor | What it means for CVM |
|---|---|
| Prepaid dominance (~82% per ICASA 2026) | The lifetime value window is short. ICASA's distinction between total and active subscriptions means even the reported subscription count can overstate revenue-generating customers. BSS-level activation and usage visibility matters more here than in postpaid-dominant markets. |
| Active subscription gap (approximately 25.9 million) | Total reported subscriptions and active subscriptions are not the same thing. Some of the difference reflects disconnection windows and reporting definitions; some may reflect dormant or low-use SIMs. Either way, gross acquisition and active, value-carrying customers must be measured separately. |
| Multi-SIM and primary-SIM behaviour | A subscriber who activates but never consolidates spend onto your network may appear in gross adds without producing durable value. Bain's 2019 research identified multi-SIM behaviour and promotional arbitrage as structural features of the South African market. Vodacom's FY2026 annual results add a current operator datapoint: data customers declined 4.3% to 26.5 million as seasonal offers supported consolidation of spend onto a primary SIM. |
| Churn 3-4x higher than developed markets (Bain, 2019) | High SIM switching and multi-SIM behaviour compress the window between acquisition and value realisation. Cohort-level measurement is a commercial necessity here, not a sophistication upgrade. |
| Structurally lower ARPU | Vodacom SA Q2 FY2026 prepaid ARPU: R57.[21] At that level, the margin for billing inefficiency or settlement leakage is thin. Getting the commercial controls right matters more, not less. |
| Multi-currency and mobile money complexity | Revenue sharing with content partners, settlement in local currencies, and mobile money reconciliation increase BSS complexity and often expose weaknesses in older or heavily customised stacks. |
Acquisition cost in context
CAC benchmarks are difficult to compare across markets because operators define acquisition cost differently. Media spend, dealer commission, SIM subsidy, device subsidy, onboarding cost, fraud loss, and settlement cost may or may not be included in any given figure. The more useful metric isn't a market benchmark. It's the operator's own Cohort True CAC, measured by channel, plan, geography, and acquisition period, a calculation that requires joining the acquisition record to downstream billing and revenue data, which is the architectural challenge this paper addresses.
Why This Matters Now
BSS market consolidation may narrow the available choices.
NEC announced a definitive agreement to acquire CSG for approximately US$2.9 billion enterprise value, with completion expected during 2026 subject to customary regulatory approvals.[22] Qvantel completed its acquisition of Optiva on 31 December 2025. Amdocs completed its acquisition of Matrixx on 23 December 2025 for net consideration of approximately US$197 million. These transactions indicate consolidation pressure in charging, monetisation, and BSS. They don't mean every operator needs to replace its stack immediately. They do mean that architecture decisions now carry strategic optionality value: waiting may reduce the range of independent choices available later.
Price competition alone is a weak MVNO strategy.
Africa Analysis documents 38 brands launched in South Africa, 21 still operating. Virgin Mobile SA closed in 2021 after 15 years. Lyca Mobile exited in January 2024. The most visible durable growth stories attach connectivity to an existing customer relationship, whether banking, retail, loyalty, or rewards. Price still matters, but price alone is a weak foundation for retention.[23] The most visible growth stories include names like Capitec, FNB, Standard Bank, and Spar.
Analytics and AI claims are common; the preconditions are rarely acknowledged.
McKinsey's 2017 base management analysis cited a comprehensive analytics-driven approach as capable of reducing churn by as much as 15%.[24] Oliver Wyman's published Orchestrating Customer Value case study reports a 22% ARPU increase and 39% revenue improvement from an automated next-best-action engine, achieved by embedding the solution within the telco's organisation and governance model and bringing together sales and customer care.[25] Both results are real. But the correct inference isn't that analytics or AI alone fixes CVM. Both outcomes depended on prediction being connected to eligibility, offer construction, charging, fulfilment, balance control, settlement, and governed execution. The analytics layer scored and recommended. The operating model and systems of record determined whether the recommendation became a commercial outcome.
Global mobile ARPU is under marginal but sustained pressure.
PwC's Global Telecom Outlook projects global mobile ARPU declining to $6.20 in 2029 from $6.32 in 2024.[26] This isn't a collapse. But in a flat-to-declining ARPU environment, billing efficiency, commission quality, retention timing, and settlement accuracy matter more than they do when revenue per subscriber is growing. Operators who close structural leakage and improve margin per customer will pull ahead of those continuing to patch campaign tools on top of disconnected commercial systems.
The commercial question itself is changing.
Vodacom, MTN, Telkom, and Cell C are each describing a version of the same problem: subscriber acquisition metrics that don't predict commercial outcomes. Vodacom shows ARPU and revenue moving independently of base size. MTN shows data traffic growing while prepaid revenue falls. Telkom shows CVM producing measurable prepaid revenue growth. Cell C shows channel discounts eroding what subscriber growth appears to deliver. The question behind all of it is the same one this paper is built around: did the acquired customer become a revenue-generating, primary-SIM relationship, and would you know if they didn't?
The Role of AI and Agents
AI is genuinely useful in a governed CVM model, but it isn't self-sufficient. The published case studies show real improvement potential, but outcomes depend on integration, operating-model design, and execution discipline, not the AI layer alone.
The appropriate roles for AI and agent-based automation are specific: cohort and value scoring; offer eligibility checks against the product catalogue and balance position before triggering; churn and complaint risk identification; channel anomaly detection; partner revenue-sharing analysis; retention and upsell recommendations executed through the systems of commercial record. Agentic automation in particular should operate within explicit policy boundaries: eligibility rules, offer-cost limits, audit trails, approval thresholds, suppression rules, rollback paths, and control-group measurement.
The platform remains the place where policy, charging, entitlement, and revenue logic are enforced. AI operates in the recommendation and detection tier. The systems of commercial record operate in the enforcement tier. A tool that advises is different from a system that acts, and conflating the two is how AI CVM deployments fail to deliver on their projections.
AI claims are common in CVM positioning right now. The honest question is whether recommendations can be converted into governed, margin-safe action. That conversion depends on the connection between the intelligence layer and the systems of commercial record. Where that connection is in place and properly governed, AI genuinely improves the speed and precision of commercial decisions. Where it isn't, the recommendations stay advisory.
What the Closed Loop Looks Like in Practice
If the argument in this paper has landed, it's probably because you've felt the disconnect it describes. You've looked at subscriber growth numbers and wondered why the revenue picture didn't follow. You've run a retention campaign and doubted whether it was reaching the customers who needed it, at the moment they needed it. You've signed off a CAC figure and suspected the real cost, measured against the customers who stayed and generated value, was materially higher.
That instinct is correct. And it's more common among people thinking clearly about these businesses than the industry tends to acknowledge.
What this paper describes isn't a theoretical improvement on what most operators run. It's a structurally different way of connecting commercial intent to commercial outcome: one where the intelligence that drives customer decisions is connected to the systems that enforce them rather than sitting above them.
For a direct consumer operator, that changes three things.
It changes when the system acts. Not on a campaign schedule, but when a customer's commercial position creates the right condition: a balance threshold crossed, a billing event completed, a tenure moment that warrants a response. The data defines the moment, not the calendar.
It changes what the commercial team manages. Instead of campaigns and segments, policy and outcomes. The team sets the rules; the systems enforce them; the outcomes feed back into the next round of policy decisions. The work shifts from execution to judgement, which is where experienced operators add the most value.
And it changes what the operator actually knows about their own business. A system that reads continuously from the commercial record, learning from each cohort's outcomes, builds a picture of customer behaviour that no standalone campaign platform sitting above those systems could build without the same depth of access. That picture is proprietary. It compounds over time and becomes one of the more durable commercial advantages available to a mid-tier operator competing in a market where price differentiation is increasingly hard to sustain.
Most operators who engage seriously with this model make the same discovery: the numbers they thought they knew look different when measured correctly. The channels they believed were performing well aren't all performing equally. The CAC they approved wasn't the CAC they actually incurred.
What would your business look like if acquisition and value realisation were genuinely connected: if every commercial decision you made about customers was informed by what actually happened to the last cohort you acquired through the same channel, on the same plan, in the same market conditions?
That isn't a hypothetical. It's a conversation worth having.
Conclusion
The evidence points in the same direction across operator, regulatory, fraud, revenue-assurance, and bank-MVNO sources. Vodacom's prepaid results show that subscriber volume, active-base quality, ARPU, prepaid revenue, data revenue, and primary-SIM behaviour can move in different directions. MTN shows that data traffic and subscriber growth do not automatically translate into prepaid revenue growth. Telkom shows CVM as a reported prepaid revenue driver. Cell C shows how distribution discounts, tariff pressure, and informal-channel acquisition affect net revenue. Capitec, FNB, Standard Bank, and Spar show mobile being embedded into banking, rewards, devices, airtime advances, app journeys, and loyalty relationships. ICASA shows the gap between total and active subscriptions in South Africa. Bain explains why multi-SIM behaviour and promotional churn matter. None of these data points alone proves the case for closed-loop CVM. Together, they describe the operating conditions in which gross-add acquisition logic becomes commercially dangerous.
These aren't edge conditions. They're normal operating conditions in prepaid, MVNO, and emerging-market telecom environments.
Operators who close the connection between acquisition economics and value realisation, who join the acquisition record to billing, usage, balance, payment, retention, settlement, and margin outcomes, won't just perform better on individual KPIs. They'll build a compounding commercial advantage, because a system that learns from cohort outcomes improves with every cycle. Operators who defer that architecture decision aren't avoiding the problem. They're allowing the acquisition-to-margin gap to keep compounding.
What would you discover if you could actually see your Cohort True CAC?
For most operators, the answer is clarifying and uncomfortable in equal measure. That discomfort is a reasonable starting point for a different commercial architecture, and a conversation worth having.
Sources
| Source | Statistic or finding | Note |
|---|---|---|
| Vodacom Group FY2024 results | SA prepaid customers: 44.9M (+7.3M); prepaid ARPU: R55 (-5.2%); contract ARPU: R301 (+1.3%) | Primary source; company cited low-ARPU additions as contributing to ARPU pressure |
| Vodacom Group FY2025 results | SA prepaid base: 39M (-13.1%); prepaid mobile customer revenue: R27.3B (+3.5%); Q4 prepaid ARPU: R55 (+12.2%) | Primary source; reflects inactive-customer optimisation |
| Vodacom Group 1H FY2026 results | SA prepaid base: 39.2M (-7.4%); prepaid revenue: R13.2B (-1.6%); Q2 prepaid ARPU: R57 (+3.6%); prepaid data revenue: R7.2B (+5.8%) | Primary source |
| Vodacom Group FY2026 annual results (year ended 31 March 2026) | Prepaid mobile customer revenue: R26.7B (-2.1%); prepaid base: 39.1M (+0.4%); prepaid ARPU: R58 (+7.4%); prepaid mobile data revenue: R14.9B (+5.0%); data customers: 26.5M (-4.3%); data traffic: +32.1%; primary-SIM consolidation cited | Primary source; published 11 May 2026 |
| MTN SA FY2025 results | Total subscribers: 40.6M (+1.9%); prepaid subscribers: 29.7M (-0.7%); consumer prepaid service revenue: -2.3%; data traffic: +27.3%; prepaid data usage: 4.2GB/month (+28.4%) | Primary source; illustrates data growth/prepaid revenue divergence |
| Telkom Q3 FY2026 trading update | Prepaid service revenue: +11.6% (attributed to CVM in results commentary); Mo'Nice/Mo'Town: 53.1% of prepaid revenue; total mobile subscribers: 25.3M (+5.3%); prepaid ARPU: R61 (stable); airtime lending: +15.9% | Primary source; CVM attribution in operator's own results is the key evidential point |
| Cell C 1H FY2026 results | Prepaid subscribers: 7.831M (+13.2%); prepaid ARPU: R71 (down from R78); distribution discounts: 10.6% of gross prepaid revenue; MVNO HLR subscribers: 5.106M (+29.6%) | Primary source; MVNO HLR figure is a platform metric, not equivalent to active end-customer count |
| Capitec Group FY2026 annual results | Connect net income: R442M (FY2025: R193M); active clients (last 3 months): 1.5M; data usage: 40.5PB; Airtime Advances: R97.3M | Primary source; principal MVNO on Cell C infrastructure, services via banking app |
| FirstRand FY2025 media release | FNB Connect service volumes: R22B; total retail revenue from related value-added services: >R2.9B | Volumes, not revenue; the distinction is material |
| FNB Connect disclosures / ITWeb / current FNB Connect page | 1M active subscribers; 26.2PB data used; 127% cumulative eSIM growth; 64,000+ device sales worth R635M; up to 15% back on qualifying SIM plan and prepaid bundle purchases | Benefits subject to account and programme qualifying rules |
| ICASA State of the ICT Sector Report, 2026 | Total SA mobile subscriptions: ~117.3M; prepaid: ~96.5M (~82%); active subscriptions (90-day): ~91.4M (-2.8%); definitional gap approximately 25.9M | Primary regulatory data; published approximately March/April 2026 |
| Bain & Company (Sub-Saharan Africa research, 2019) | 1 in 3 SA subscribers uses multiple SIM cards; churn 3-4x higher than developed markets | Published 2019; treated as structural market behaviour, not current-year measurement |
| CFCA Global Fraud Loss Survey, 2023 | Total telecommunications fraud: $38.95B globally (~2.5% of revenues) | All fraud categories; does not quantify channel or activation fraud specifically |
| COMRiC sector report (via TechCentral, ITWeb, 2025) | SA telecom-related fraud losses ~R5.3B annually; fraud-linked volumes up 78% from 2022 to 2023 | Via reputable trade press coverage |
| PwC Global Telecom Outlook 2025-2029 | Global mobile ARPU: $6.32 (2024), projected $6.20 (2029) | Primary published outlook; marginal decline, not collapse |
| Africa Analysis, 2025 | SA MVNO market: 38 brands launched; 21 active; ~3.8M subscribers; +19% YoY | Published market summary |
| Telecom Review Africa | SA MVNO market estimate: ~$505M (2025), ~$750M by 2030 | Analyst estimate; directional only |
| Mordor Intelligence | SA MVNO market estimate: ~$505M (2025), ~$784M by 2031 at ~7.62% CAGR | Different horizon; do not blend with Telecom Review Africa figures |
| ITWeb / TechCentral | Virgin Mobile SA closure (2021); earlier Capitec Connect growth reporting | Trade press; Capitec FY2026 annual results now provide primary-source Connect data |
| TechCentral | Lyca Mobile exit from South Africa, January 2024 | Trade press reporting |
| SPAR Mobile / TechCentral | Spar Mobile launched on MTN; grocery-linked data rewards | Retail-loyalty MVNO example |
| Standard Bank newsroom | Standard Bank Mobile: 300,000+ customers; bank fees offered back in airtime | Primary corporate source |
| MyBroadband / trade reporting on Standard Bank Connect | Reported approximately 350,000 subscribers after MTN transition; greater in-house stack control cited as enabling more flexible product structuring | Trade reporting, not primary corporate disclosure |
| TM Forum Revenue Assurance Survey Report 2017/18 | Measured average leakage ~0.9%; estimated average ~1.9%; top-tier RA organisations achieve below 0.2% | Survey-based benchmark; older, but directionally useful |
| McKinsey, base management analytics analysis, 2017 | Analytics-driven approach cited as capable of reducing churn by as much as 15% | 2017 publication; analytics-driven base management, not agentic AI |
| Oliver Wyman, "Orchestrating Customer Value" case study | 22% ARPU increase and 39% revenue improvement; required system integration, organisational alignment, and governance | Outcomes attributed to integration and operating model design, not AI alone |
| NEC / CSG announcements | Definitive agreement for NEC to acquire CSG at ~US$2.9B enterprise value | Completion expected 2026, subject to regulatory approvals; not confirmed completed at time of writing |
| Qvantel / Optiva | Acquisition completed 31 December 2025 | Confirmed completed |
| Amdocs / Matrixx | Acquisition completed 23 December 2025; net consideration ~US$197M | Confirmed completed |
| MVNO Index, January 2025; Spenza, 2025 | "Many MVNOs underestimated the cost and complexity of customer acquisition in a saturated market"; "Cheap plans attract low-value, high-churn customers" | Practitioner community sources |
About TAUSPACE
TAUSPACE is a Johannesburg-based B/OSS technology and advisory firm specialising in commercial architecture for telecommunications operators, MVNOs, and financial services providers across Africa and emerging markets. Its flagship platform, fullCIRCLE NEXT, provides operators with a unified system of commercial record covering real-time charging, billing, balance management, product catalogue, and partner settlement. nfinity is TAUSPACE's CVM module, operating on fullCIRCLE NEXT as the commercial foundation or as an adjacent intelligence layer across existing operator stacks. TAUSPACE's work spans platform deployment, commercial modelling, and the design of AI-native operating models for operators navigating multi-cloud and sovereign-AI environments.
About the Authors
Rajesh Hari Parsad is the Founder and CEO of TAUSPACE and heads the firm's Product Design and Innovation practice from Johannesburg. He has spent twenty-five years building B/OSS platforms and shaping 5G monetisation strategies for telecommunications operators and financial services clients, and now leads TAUSPACE's AI-native B/OSS roadmap.
Dr. Ndirangu Kibata is the Chief of Strategy and Growth at TAUSPACE. He has spent over thirty years in African telecommunications, including a foundational architectural role in the launch of a major mobile operator and one of the continent's earliest commercial mobile-money infrastructure deployments. He writes regularly on AI and 5G strategy for emerging-market operators and holds a PhD in Engineering.
Vodacom Group FY2024 results. Vodacom SA prepaid customers: 44.9 million (+7.3 million). Prepaid ARPU: R55, down 5.2%. Contract ARPU: R301, up 1.3%. Company cited low-ARPU additions as contributing to ARPU pressure. ↩︎
Vodacom Group FY2025 results. Vodacom SA prepaid base declined 13.1% to 39 million following inactive-customer optimisation. Prepaid mobile customer revenue: R27.3 billion, up 3.5%. Q4 prepaid ARPU: R55, up 12.2%. ↩︎
Vodacom Group 1H FY2026 results. Vodacom SA prepaid base: 39.2 million (-7.4%). Prepaid customer revenue: R13.2 billion (-1.6%). Q2 prepaid ARPU: R57 (+3.6%). Prepaid mobile data revenue: R7.2 billion (+5.8%). ↩︎
Vodacom Group FY2026 annual results (year ended 31 March 2026, published 11 May 2026). Vodacom SA prepaid mobile customer revenue: R26.7 billion (-2.1%). Prepaid base: 39.1 million (+0.4%). Prepaid ARPU: R58 (+7.4%). Prepaid mobile data revenue: R14.9 billion (+5.0%). Data customers: 26.5 million (-4.3%). Data traffic: +32.1%. Vodacom cited seasonal offers as supporting consolidation of spend onto a primary SIM and continued focus on quality of gross adds. ↩︎
MTN SA FY2025 results. Total subscribers: 40.6 million (+1.9%). Prepaid subscribers: 29.7 million (-0.7%). Consumer prepaid service revenue: -2.3%. Data traffic: +27.3%. Prepaid average monthly data usage: 4.2GB (+28.4%). MTN cited interventions including regional offers, personalised bundle pricing, channel optimisation, device-financing models, and bad-debt reduction in assisted and third-party channels. ↩︎
Telkom Q3 FY2026 trading update. Prepaid service revenue: +11.6%, attributed to Customer Value Management. Mo'Nice and Mo'Town: 53.1% of prepaid service revenue. Total mobile subscribers: 25.3 million (+5.3%). Prepaid subscribers: 22.2 million (+5.8%). Prepaid ARPU: R61 (stable). Airtime lending: +15.9%, representing 25.8% of prepaid recharges. ↩︎
Cell C 1H FY2026 results. Prepaid subscribers: 7.831 million (+13.2%). Prepaid ARPU: R71 (down from R78), attributed to 14% effective reduction in data tariffs. Distribution-channel discounts: 10.6% of gross prepaid revenue. Cell C stated normalising discounts toward 6% should add approximately R135 million to net prepaid revenue and EBITDA. MVNO HLR subscribers: 5.106 million (+29.6%); cited as platform-scale metric, not equivalent to active end-customer count. ↩︎
Bain & Company, Sub-Saharan Africa telecom research (published 2019). One in three South African subscribers uses multiple SIM cards; primary motivation: cheaper prices and promotions. Churn in South Africa identified as three to four times higher than in developed markets. Treated as structural market behaviour rather than a current-year measurement given publication date. ↩︎ ↩︎
TM Forum Revenue Assurance Survey Report 2017/18. Estimated average revenue leakage: 1.9% of revenues. Measured average: 0.9%. Top-tier revenue assurance organisations achieve leakage below 0.2% before recovery procedures. Survey-based industry benchmark; individual operator experience varies significantly. ↩︎
CFCA (Communications Fraud Control Association) Global Fraud Loss Survey, 2023. Total telecommunications fraud estimated at $38.95 billion, approximately 2.5% of global telecom revenues. Covers all fraud categories; channel and activation fraud are subsets of the total. ↩︎
COMRiC sector report, as reported by TechCentral and ITWeb (2025). SA telecom-related fraud losses approximately R5.3 billion annually; fraud-linked transaction volumes up 78% from 2022 to 2023. ↩︎
Telecom Review Africa cites an estimate of approximately $505M for 2025 and $750M by 2030. Mordor Intelligence estimates a similar 2025 base but projects $784M by 2031 at approximately 7.62% CAGR. Analyst estimates vary by scope and methodology; treat as directional. ↩︎
Africa Analysis, 2025. SA MVNO market: 38 brands launched; 21 active; approximately 3.8 million subscribers; +19% YoY growth. ↩︎
ITWeb. Virgin Mobile SA closure reported 2021. ↩︎
TechCentral. Lyca Mobile exit from South Africa reported January 2024. ↩︎
Capitec Group FY2026 annual results. Capitec Connect net income: R442 million (FY2025: R193 million). Clients active in last three months: 1.5 million (FY2025: 0.9 million). Data usage excluding reward data: 40.5PB. Voice usage: 768 million minutes. Airtime Advances: R97.3 million. Data rewards delivered since 1 March 2025: 3.2PB. Capitec discloses Connect as a principal MVNO arrangement on Cell C's infrastructure, with services sold through the Capitec banking application. ↩︎
FirstRand FY2025 media release and FNB Connect disclosures. FNB Connect active subscribers: one million. FNB Connect service volumes: R22 billion (volumes, not revenue; total retail revenue from related value-added services exceeded R2.9 billion). Data used: 26.2PB (12 months to June 2025). eBucks earned on airtime: approximately R29 million. Data rewards distributed: estimated retail value R4.5 billion. eSIM growth: 127% cumulative since October 2024 launch; eSIMs representing 10% of monthly SIM sales. Device sales: 64,000+ worth R635 million. Current FNB Connect page advertises up to 15% back on SIM plan and prepaid bundle purchases, subject to qualifying rules. ↩︎
Standard Bank newsroom. Standard Bank Mobile: 300,000+ customers; bank fees offered back in airtime. Market reporting (trade press) indicates approximately 350,000 subscribers following transition to MTN network, with greater in-house control over MVNO technology stack enabling more flexible product structuring. Use the 300,000+ figure as the primary-sourced official number. ↩︎
TechCentral. Spar Mobile launched on MTN's network, May 2025, with data rewards linked to grocery shopping behaviour. ↩︎
ICASA State of the ICT Sector Report, 2026 (published approximately March/April 2026). Total mobile cellular subscriptions approximately 117.3 million; prepaid approximately 96.5 million; postpaid approximately 20.8 million. Prepaid share approximately 82.3%. Active subscriptions (90-day definition) declined 2.8% to approximately 91.4 million. ICASA notes that reported subscription counts may include SIMs not yet disconnected within the 90-day operator window. ↩︎
Vodacom Group 1H FY2026 results. Vodacom SA Q2 prepaid ARPU: R57, up 3.6%. ↩︎
NEC and CSG announced definitive agreement for NEC to acquire CSG at approximately US$2.9 billion enterprise value. Completion expected 2026 calendar year, subject to customary regulatory approvals. Not confirmed as completed at time of writing. ↩︎
MVNO Index, January 2025: "Many MVNOs underestimated the cost and complexity of customer acquisition in a saturated market." Spenza, 2025: "Cheap plans attract low-value, high-churn customers." ↩︎
McKinsey, "Telecoms, Media and Technology" base management analytics analysis, 2017. A comprehensive analytics-driven approach to base management cited as capable of reducing churn by as much as 15%. Refers to analytics-driven intervention, not agentic AI in the current sense. ↩︎
Oliver Wyman, "Orchestrating Customer Value" published case study. Automated NBA engine cited as delivering 22% ARPU increase and 39% revenue improvement. Required embedding within the telco's organisation and governance model, and alignment of sales and customer care. System integration, operating model design, and governance, not the AI layer alone, were the determining factors. ↩︎
PwC Perspectives from the Global Telecom Outlook 2025-2029. Global mobile ARPU expected to decline marginally to $6.20 in 2029 from $6.32 in 2024. ↩︎